Find your traffic sources
Compare direct visits and referrers to see which channels send people your way.
Understand where link traffic comes from, what devices people use, and which campaigns deserve your next move - all in one reporting workspace.
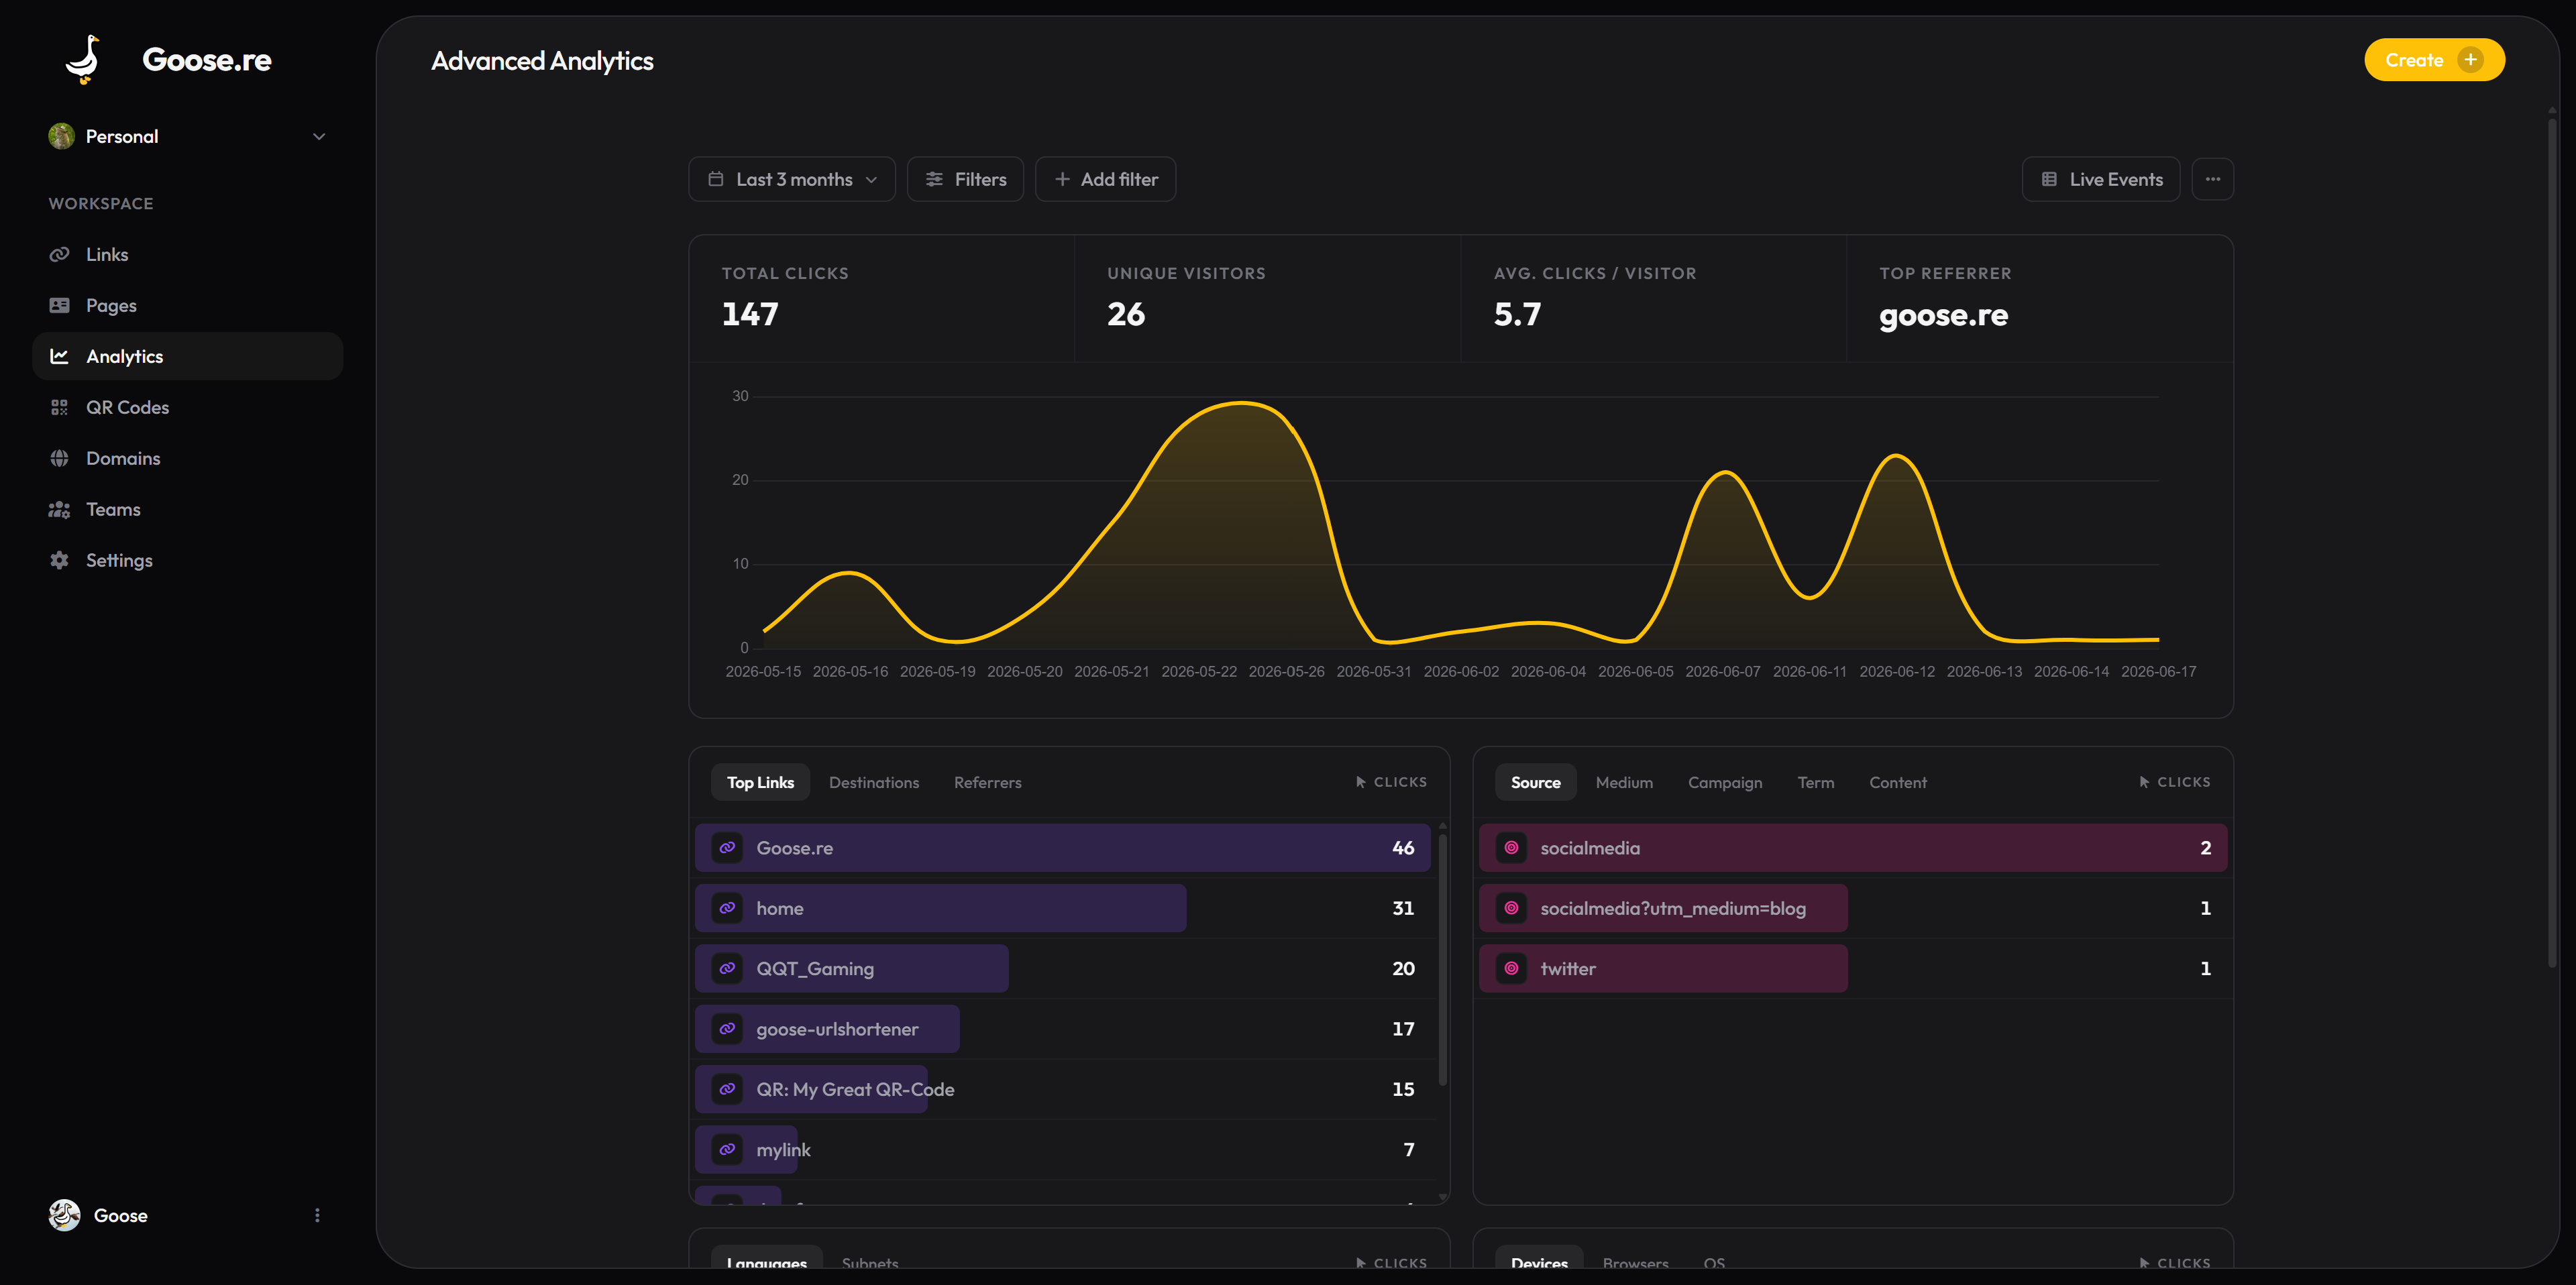
Goose Analytics
Compare direct visits and referrers to see which channels send people your way.
Break clicks down by location, device type, browser, and operating system.
Export filtered analytics as CSV for reporting or further analysis.
A closer look at the product capabilities behind the workflow.
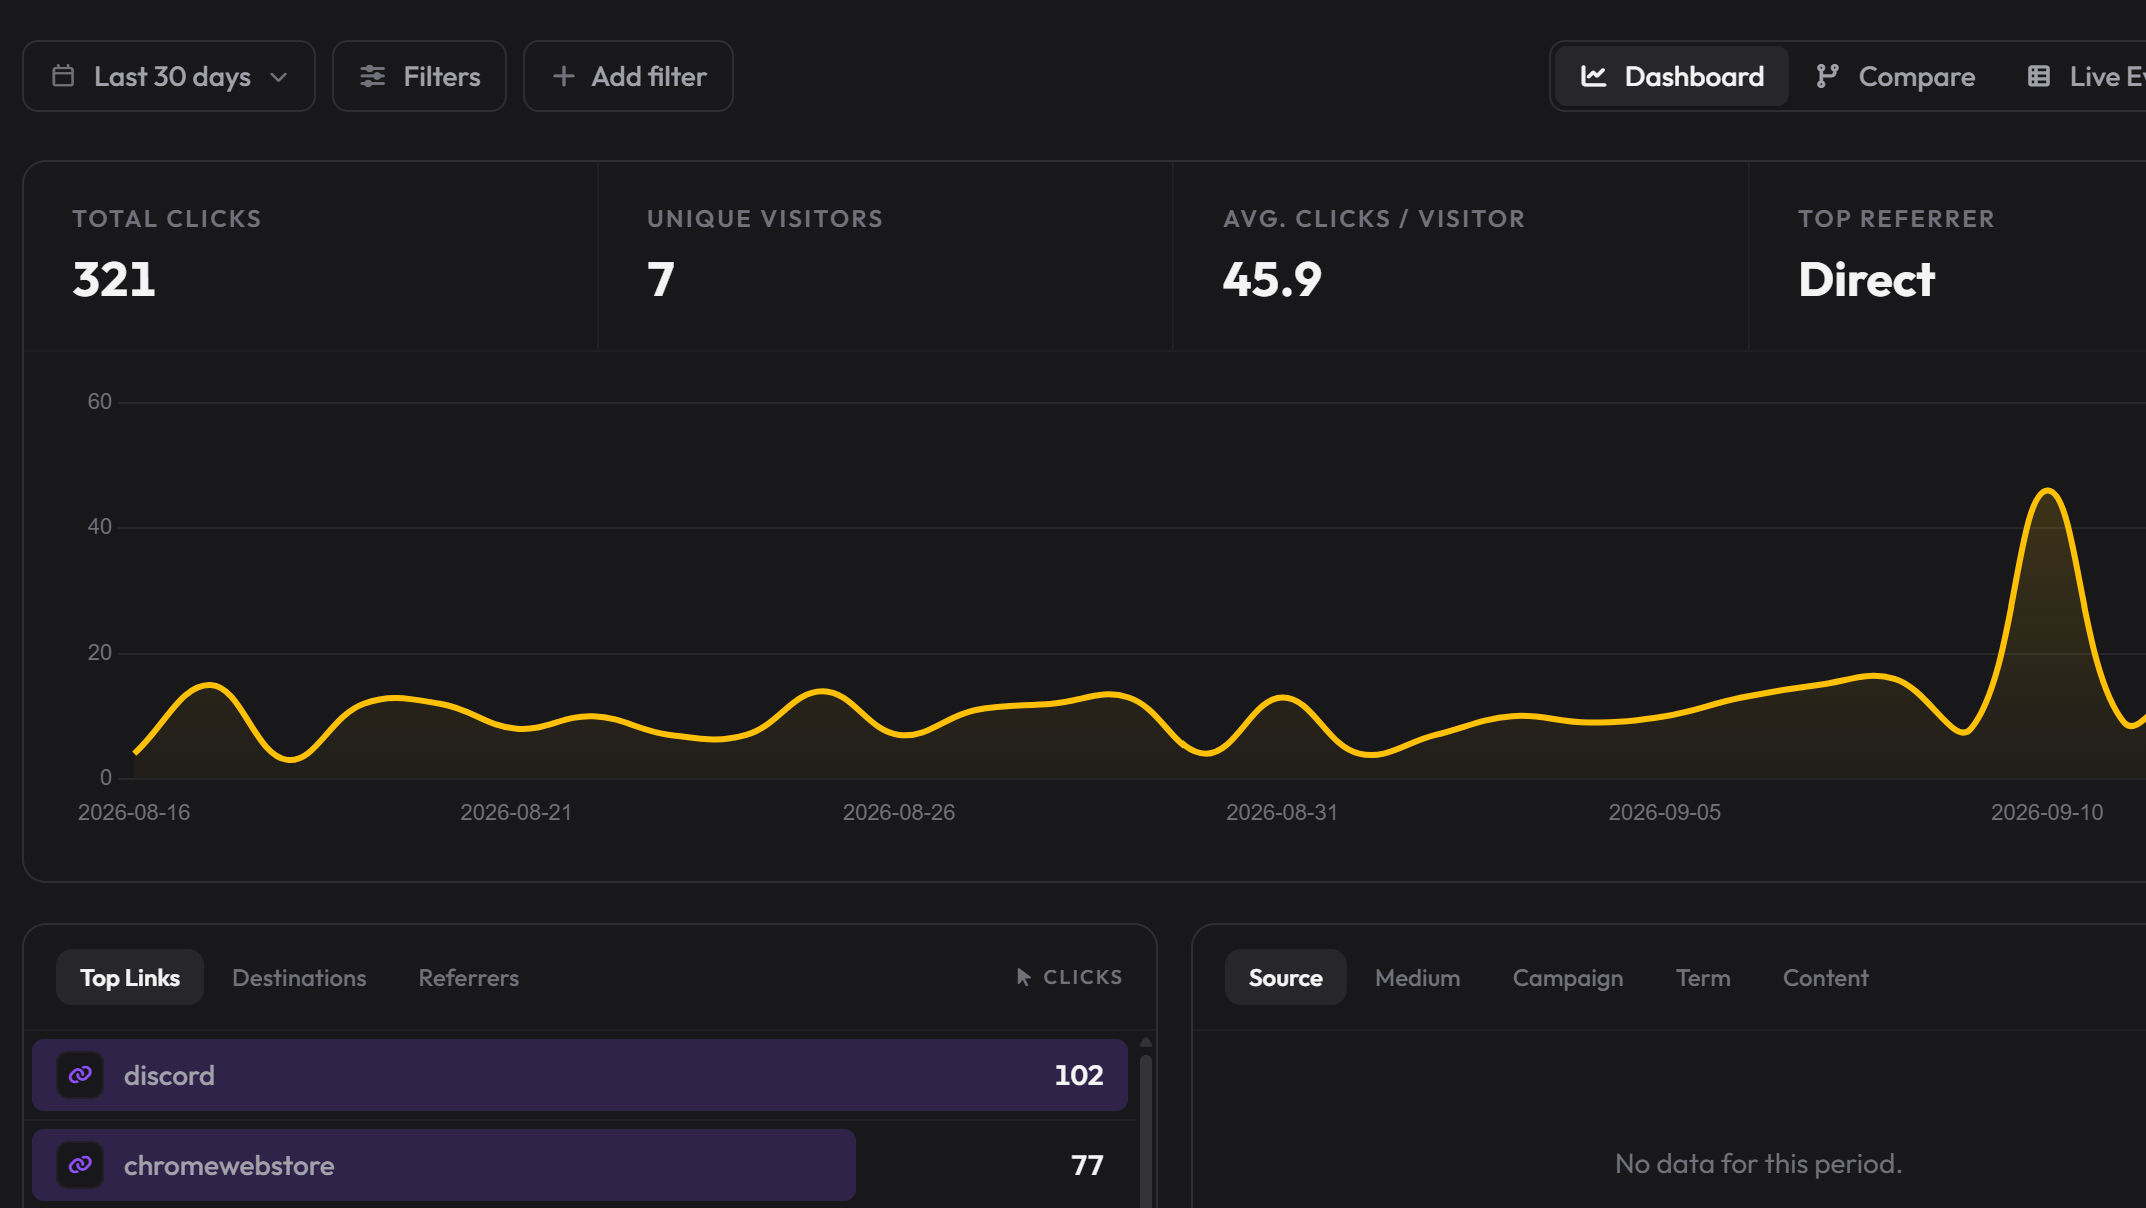
A click count is only the beginning. Breakdowns reveal how people arrived and the technology they used.
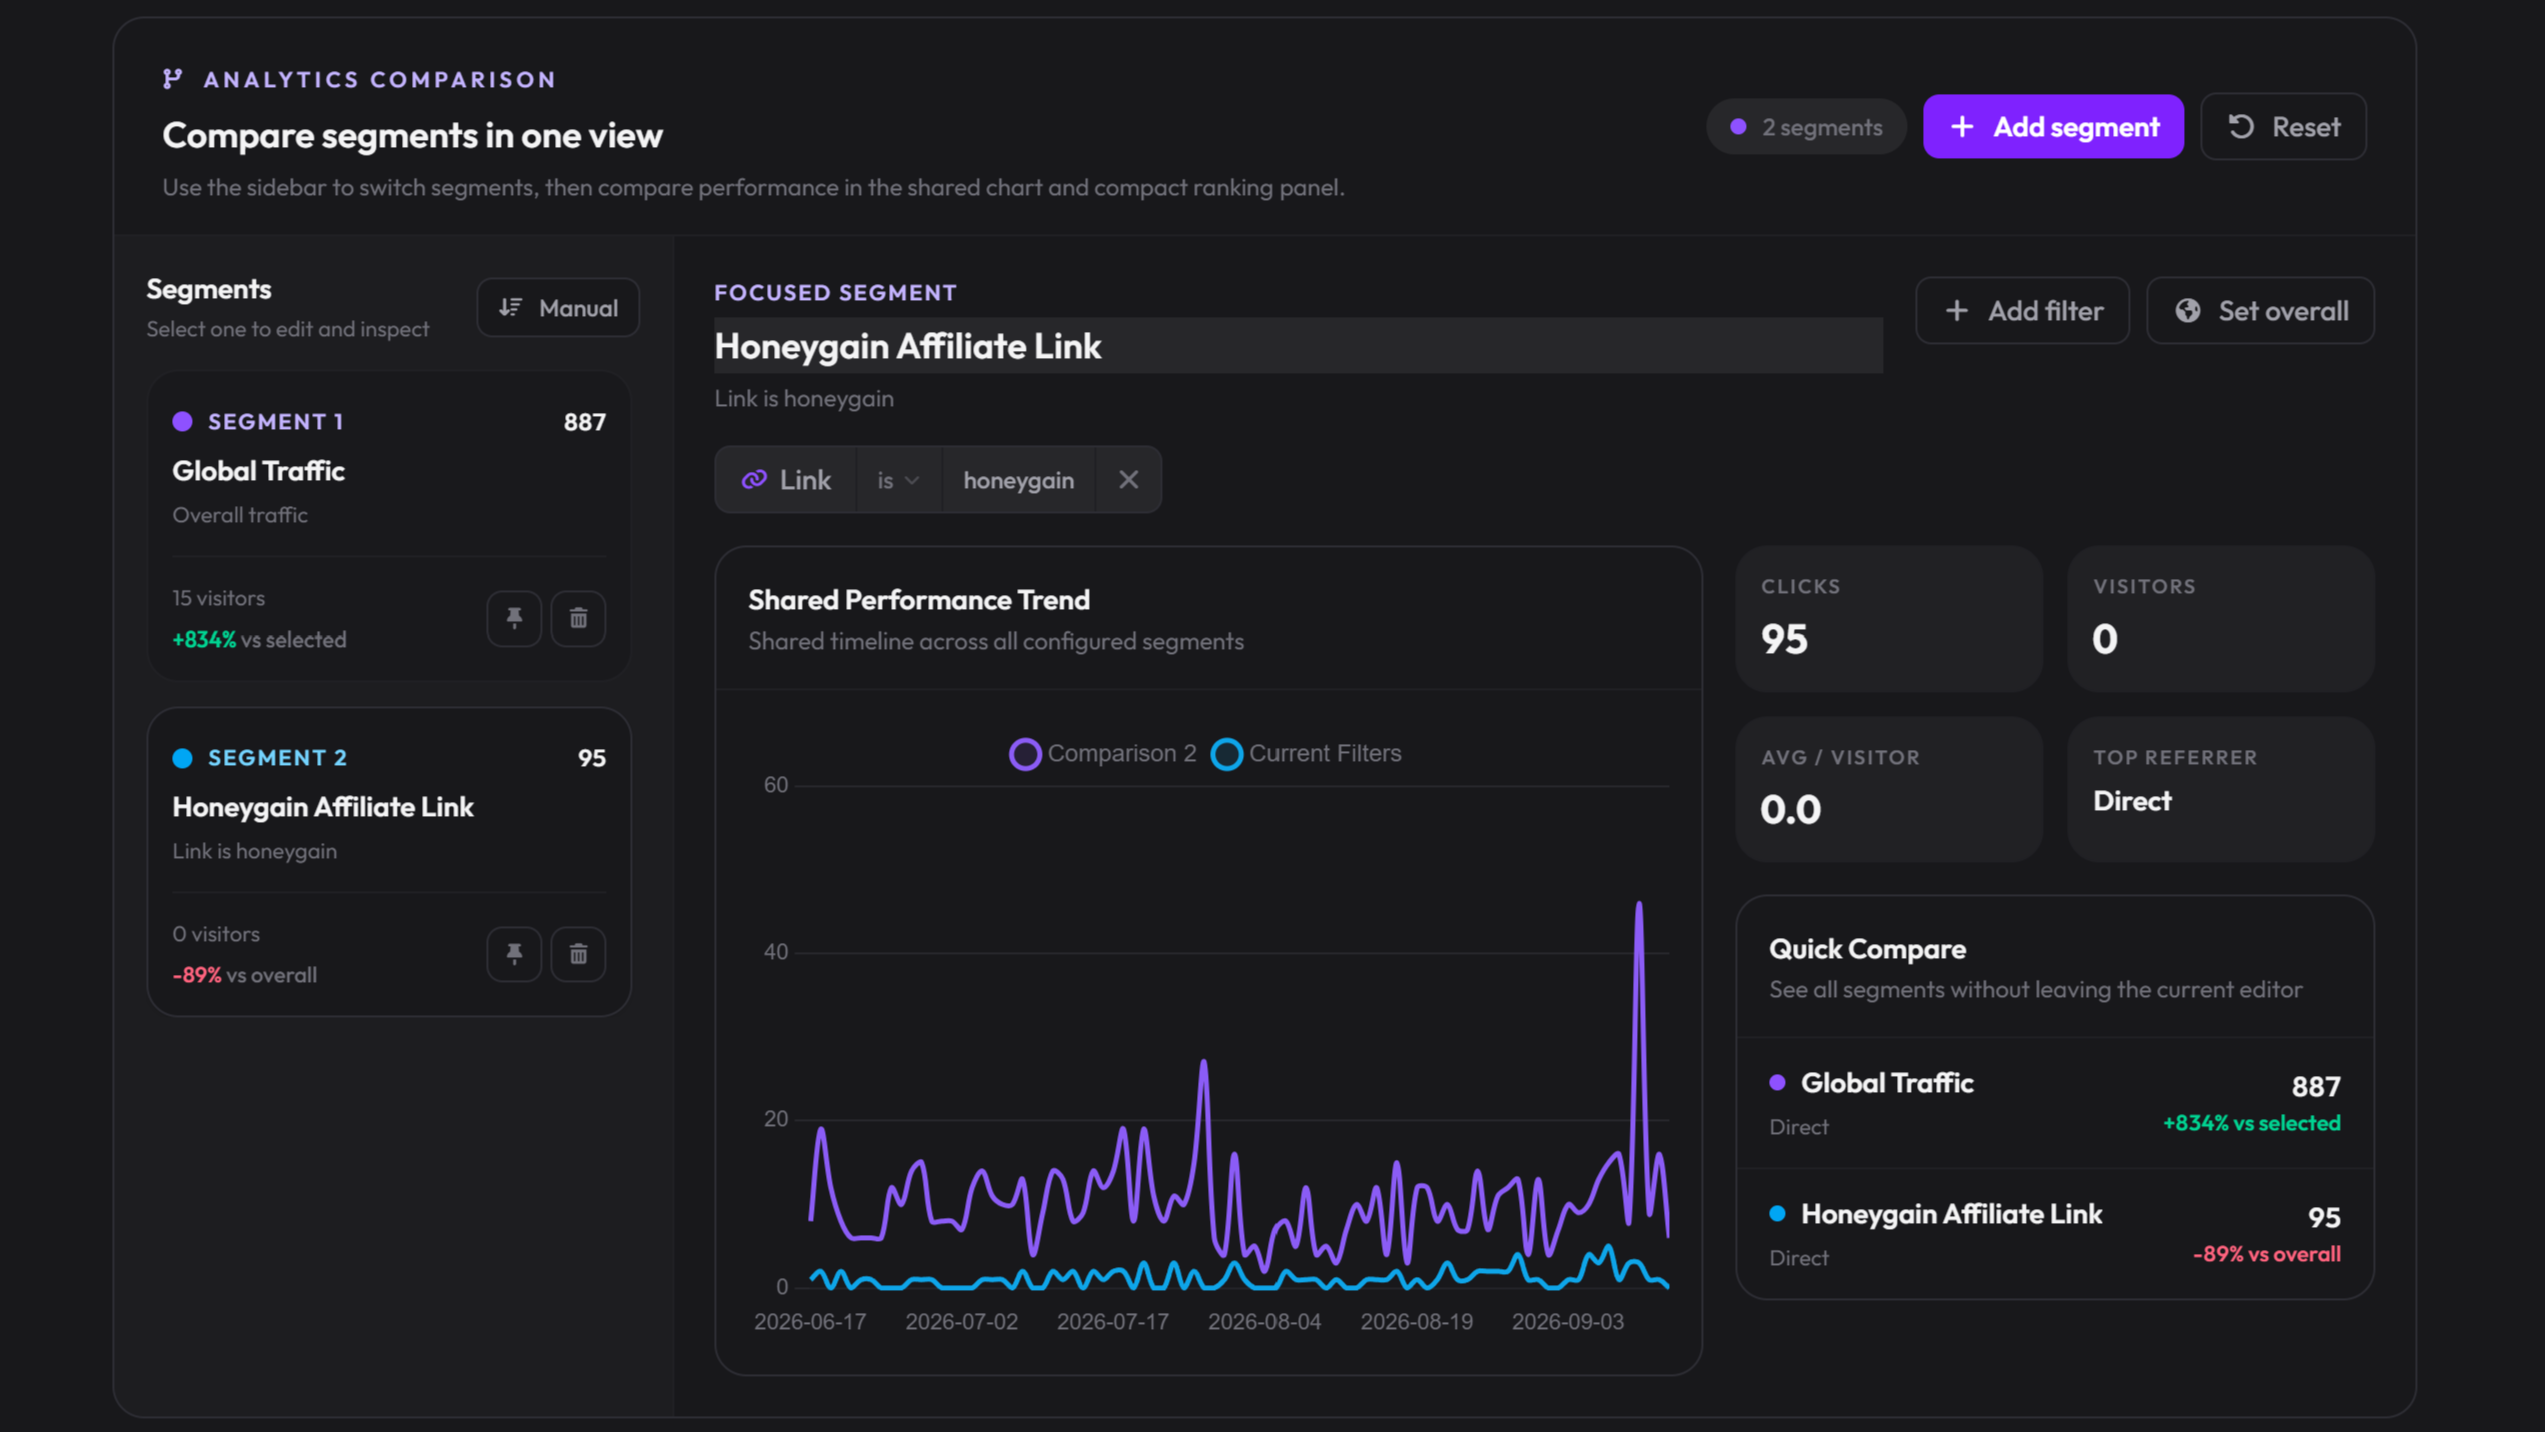
Use date ranges and campaign dimensions to narrow the view, compare meaningful segments, and prepare a report outside Goose.re.
More from Goose.re
Everything you need to know about Goose.re.
Create a Goose.re account and start building links with reporting already connected.